San Francisco Community Indicators

PUBLIC SAFETY

  Percentage of San Franciscans who feel safe or very safe walking alone in their neighborhoods during the day
  Percentage of San Franciscans who feel safe or very safe walking alone in their neighborhoods at night
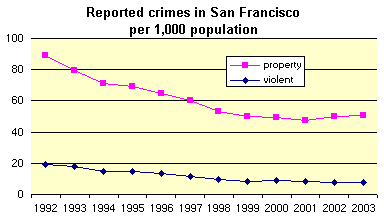
==> Number of violent crimes per 1000 population
==> Number of property crimes per 1000 population
  Percentage of violent crimes cleared by police
  Percentage of property crimes cleared by police
  Average time from receipt of top priority call to police arrival on scene
Number of traffic accidents that result in injuries
Number of traffic accidents that result in death
Percentage of San Franciscans who feel safe or very safe crossing the street
  First unit EMS response time, average
  First unit EMS response time, 90th percentile


SAN FRANCISCO CRIME RATE IS DOWN

Reported crimes per 1,000 population

Source: San Francisco Police Department, FBI, California Department of Justice

San Francisco's crime rates, both for violent and property crimes, have dropped significantly since 1992. In 2004, approximately 50.6 property crimes were reported per 1,000 San Franciscans, the same figure as 2003. About 7.4 violent crimes were reported per 1,000 residents.


For more information: