GOVERNMENT
| Percentage surveyed who rate the performance of local government as good or very good | |
| ==> | Percentage of eligible adults who are registered to vote |
| Percentage of registered voters who voted in November election | |
| Number of city employees per 1000 population | |
| Property tax rate | |
| Net general bonded debt per capita |
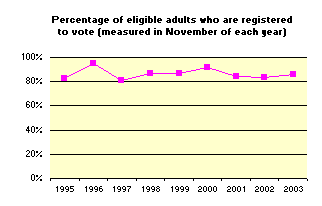
MOST ELIGIBLE RESIDENTS REGISTER TO VOTE
|
Sources: San Francisco Department of Elections and State of California, Department of Finance, California County Population Estimates and Components of Change, July 1, (2000 - 2003), February 2004.
|
Between 81% and 95% of San Franciscans who are eligible to vote have registered in elections from 1995 to 2003. In the most recent election, 86% of eligible voters registered to vote. A higher percentage of eligible voters registers for presidential elections (as seen in 1996 and 2000).
|
Note: The eligible voting population is an estimate based on the 2000 U.S. Census, which found that 84% of people living in San Francisco are U.S. citizens. After accounting for differing percentages of citizenship by age, and for other eligibility factors (such as felony status), we estimated the eligible voting population at 80% of adults. Estimates do not take into account changes in age and citizenship makeup of SF population over time.
For more information:
- Data (Excel)
- San Francisco Department
of Elections Web site (http://www.sfgov.org/election)
last updated 5/25/04
